
The Complete Guide to AI SIEM Evaluation in 2026: How to Assess an AI-Powered Cybersecurity Platform
Quick answer To evaluate an AI SIEM in 2026, measure outcomes rather than features. Baseline your current MTTD, MTTR, alert volume, and false-positive rate. Score vendors across eight pillars, from detection efficacy to TCO. Run a structured proof of value with simulated attacks, and apply a “unification test” to confirm that SIEM, extended detection and response (XDR), security orchestration automation and response (SOAR), and threat intelligence genuinely share one data layer rather than being bundled products. The right AI-powered cybersecurity platform is the one that reduces alert fatigue and automates response in your environment, not in a demo. |
Almost every SIEM vendor now claims AI, automation, and a unified platform. The claims sound similar, but the architectures and outcomes underneath them differ widely. For enterprise security operations teams, a wrong choice means years of tuning, integration upkeep, and analyst burnout.
This guide gives you a repeatable evaluation framework. Use it to build an RFP, structure a proof of value (POV), and make a defensible recommendation to your CISO or board.
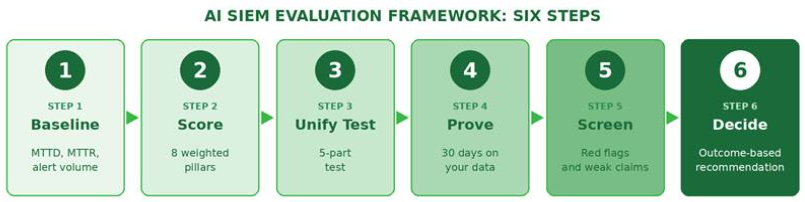
Quick answer Before contacting vendors, measure your current SOC performance. Without a baseline for MTTD, MTTR, daily alert volume, false-positive rate, and automation rate, you cannot prove any AI SIEM improved anything. |
Feature checklists favor vendors with the longest datasheets. Outcome metrics favor the platform that actually works in your environment. Capture these baselines first:
| Metric | How to Measure Today | Target to Set for Vendors |
| Mean time to detect (MTTD) | Time from first malicious event to alert, from recent incidents | Minutes, not hours |
| Mean time to respond (MTTR) | Time from alert to containment | Automated containment for common scenarios |
| Daily alert volume | Alerts generated per day across all tools | Significant reduction in analyst-facing alerts |
| False-positive rate | Share of triaged alerts closed as benign | Measurable reduction during POV |
| Automation rate | Share of incidents resolved without manual steps | Majority of Tier-1 workflows automated |
| Integration overhead | Engineering hours per month spent on connectors and rules | Reduced maintenance burden |
| Console count | Tools an analyst uses to close one incident | One |
Share these baselines with vendors up front. Serious vendors will commit to measurable improvement targets. Vendors that avoid them are telling you something.
Quick answer Evaluate every AI SIEM against eight pillars: detection efficacy, alert fatigue reduction, automated investigation, SOC automation, XDR coverage, threat intelligence, architecture and deployment, and operations and TCO. Weight each pillar by your priorities. |
Ask how the AI detects threats, not just whether it does. Look for behavioral models that baseline users, hosts, and applications, and that detect credential abuse and lateral movement without handwritten rules. Ask how many detections work out of the box and how coverage maps to MITRE ATT&CK.
The best AI SIEM reduces what analysts see, not just what it scores. Test whether related alerts are automatically merged into single incidents, and whether prioritization uses asset criticality, user risk, and threat intelligence context.
Evaluate whether the platform enriches and correlates alerts before an analyst opens them. A strong platform reconstructs the attack chain (entry point, affected assets, lateral movement, and data at risk) automatically.
Security orchestration automation and response should be triggered by detections inside the same platform. Check the playbook library, how easy playbooks are to build and modify, and whether response actions work through your existing firewalls, EDR, and identity providers.
Confirm which telemetry the AI analyzes natively: logs, network flows, endpoint, identity, cloud, and OT. Log-only analytics misses behaviors visible only in network traffic or endpoint activity.
Threat intelligence should enrich events at ingestion, not sit in a separate portal. Ask about feed count and quality, STIX/TAXII support, retroactive IOC matching against historical data, and whether you can add your own sector-specific feeds.
Assess scalability, deployment options (SaaS, on-premises, hybrid, air-gapped), data residency controls, and multi-tenancy. These matter to regulated industries, sovereign environments, MSSPs, and multi-business-unit enterprises.
Model three-year costs, including licensing, infrastructure, integration services, and staffing. Ingestion-based pricing can penalize visibility as data grows. Clarify which modules are included and which are add-ons.
| Pillar | Suggested Weight | Key Evidence to Collect |
| 1. Detection efficacy | 20% | POV detection rate on simulated attacks |
| 2. Alert fatigue reduction | 15% | Alert-to-incident ratio during POV |
| 3. Automated investigation | 15% | Time to a complete incident narrative |
| 4. SOC automation (SOAR) | 15% | Share of scenarios contained without manual steps |
| 5. XDR coverage | 10% | Native telemetry types analyzed |
| 6. Threat intelligence | 5% | Enrichment at ingestion; retroactive matching |
| 7. Architecture and deployment | 10% | Deployment fit; scalability evidence |
| 8. Operations and TCO | 10% | Three-year cost model; maintenance hours |
| Total | 100% |
Adjust the weights to your priorities. MSSPs typically weight Pillar 7 higher. Regulated enterprises often raise compliance and deployment weighting.
Quick answer A truly integrated cybersecurity platform passes five tests: one data model, one incident object, native response, threat intelligence applied at ingestion, and one console with one license. Bundled products that were acquired and connected often fail at least one. |
Many vendors describe their portfolios as “unified.” In practice, some are separate products under one brand, connected by APIs and sold as a bundle. The difference shows up in response speed, data consistency, and operational effort.
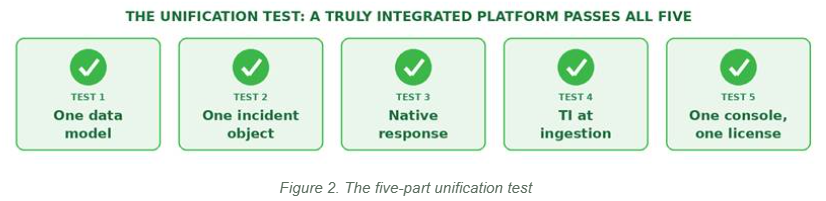
| Test | How to Verify | Red Flag |
| 1. One data model | Ask whether SIEM, XDR, and UEBA query the same data store | Separate data stores synced through connectors |
| 2. One incident object | Trigger a multi-stage attack and see whether it appears as one incident | Separate alerts in separate consoles for the same attack |
| 3. Native response | Have a detection trigger containment with no external SOAR | Response requires a separately licensed product |
| 4. Threat intelligence at ingestion | Check whether events are enriched as they arrive | Intelligence is only looked up during manual investigation |
| 5. One console, one license | Walk an analyst through a full incident from alert to closure | Multiple logins, pivots, or contract line items |
A platform that passes all five lets AI act on complete context. That is the foundation for real SOC automation.
Quick answer A proof of value should run on your own data, include simulated attacks across the kill chain, and measure results against your baselines. Four weeks is typically enough to evaluate detection, alert reduction, and automated response. |
Demos use curated data. A POV shows how the platform behaves in your environment. Structure it like this:
| Week | Focus | Success Criteria |
| Week 1 | Deploy and onboard priority data sources (identity, firewall, endpoint, cloud, network flows) | Data sources connected; time-to-first-detection recorded |
| Week 2 | Observe detections on live traffic with default content only | Alert volume, alert-to-incident ratio, false-positive rate |
| Week 3 | Run simulated attacks (see scenarios below) | Detection rate, MTTD, completeness of attack-chain reconstruction |
| Week 4 | Enable automated response playbooks in controlled scope | MTTR, share of scenarios contained automatically, analyst effort |
■ Credential compromise to lateral movement: password spraying, successful login, then east-west reconnaissance.
■ Ransomware precursors: suspicious PowerShell, privilege escalation, mass file access.
■ Data exfiltration: unusual upload volumes to rare external destinations or DNS tunneling.
■ Cloud misuse: risky IAM changes and access to exposed storage.
■ Insider risk: abnormal data access by a privileged user outside normal hours.
Use a breach and attack simulation tool or a red team exercise to make these tests repeatable. Run the same scenarios against every shortlisted vendor so the results are comparable.
Red flags during AI SIEM evaluation ✖ “AI” that is only a chatbot. A generative AI assistant for search is useful, but it is not AI-driven detection or response. ✖ Detection that depends on professional services. If good results require months of custom rule writing, factor that cost and time into TCO. ✖ Response sold separately. If SOAR or XDR requires another license, the platform is not unified. ✖ Log-only visibility. Platforms that cannot analyze network flows or endpoint telemetry natively will miss attack stages. ✖ Refusal to commit to POV metrics. Vendors confident in outcomes will agree to measurable targets. ✖ Vendor lock-in for response. If automated containment works only with the vendor’s own endpoint or firewall products, your existing investments lose value. ✖ Unclear data residency. Regulated organizations need clear answers on where data is stored and processed. |
Quick answer Score each vendor from 1 to 5 on every pillar, apply your weights, and combine the result with the unification test and POV outcomes. The platform with the best measured outcomes in your environment should win, not the one with the most features. |
| Score | Meaning |
| 5 | Exceeded target in POV with measurable evidence |
| 4 | Met target in POV |
| 3 | Partially met target, or capability shown in demo only |
| 2 | Requires add-on product, custom development, or services |
| 1 | Not supported |
Multiply each score by its pillar weight to get a weighted total. Then treat the unification test as a qualifying gate: a platform that fails more than one of the five tests should justify the added integration cost before advancing.
When presenting to leadership, frame the recommendation around outcomes. Show projected MTTD and MTTR improvement, analyst hours saved, tools consolidated, and three-year TCO against the current state.
The Seceon Open Threat Management (OTM) Platform is an AI-powered cybersecurity platform that combines aiSIEM, aiXDR, aiSOAR, UEBA, NDR, and threat intelligence on one data layer. Here is how it maps to each pillar:
| Pillar | Seceon Capability |
| Detection efficacy | Thousands of ML models and Dynamic Threat Models baseline behavior and detect threats with minimal rule authoring, mapped to MITRE ATT&CK |
| Alert fatigue reduction | Correlated incidents instead of isolated alerts; up to 95% false-positive reduction |
| Automated investigation | Cross-domain correlation reconstructs multi-stage attack chains with root-cause context |
| SOC automation (SOAR) | Native aiSOAR automates ~70% of incident response, with containment in under 90 seconds |
| XDR coverage | Native analysis of logs, network flows, endpoint, identity, cloud, and OT telemetry |
| Threat intelligence | 100+ feeds applied at ingestion; STIX/TAXII support; retroactive IOC matching |
| Architecture and deployment | SaaS, on-premises, hybrid, private cloud, and air-gapped; native multi-tenant, multi-tier architecture |
| Operations and TCO | Consolidated licensing, 950+ pre-built connectors, up to 58% TCO reduction |
Seceon is designed to pass all five tests. Detection, investigation, and response share one data layer. A multi-stage attack becomes one incident. Containment executes natively through the customer’s existing firewalls, EDR, and identity tools. Threat intelligence enriches every event at ingestion. Analysts work in one console under one licensing model.
Seceon supports structured proofs of value on customer data. For repeatable attack simulation during Week 3, organizations can pair the evaluation with aiBAS360, Seceon’s breach and attack simulation capability, to test detection and response across the MITRE ATT&CK kill chain.
| Outcome | Seceon OTM Platform* |
| Mean time to detect | Under 5 minutes |
| Automated response | Under 90 seconds |
| False-positive reduction | Up to 95% |
| Automated incident response | ~70% |
| Analyst productivity | 3–5x improvement |
| TCO reduction | Up to 58% |
| Scale | ~1.7 trillion events/day across 9,000+ customers |
Seceon platform figures; results vary by environment and deployment scope.